Image Details
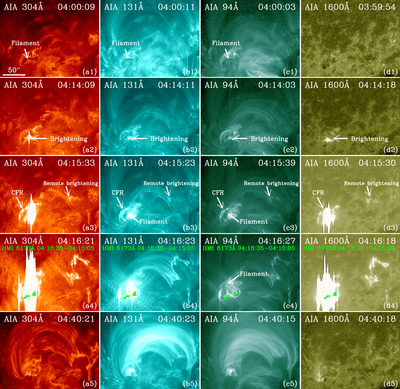
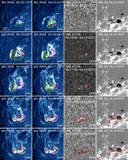
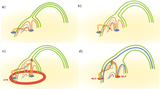
Caption: Figure 8.
Different stages of the flare. Panels (a1)–(a5), (b1)–(b5), (c1)–(c5), and (d1)–(d5) show the AIA 304 Å, 131 Å, 94 Å, and 1600 Å images, respectively. For each passband, we show images taken at five different times, 04:00 UT (before the flare), 04:14 UT (occurrence of a brightening below the filament), 04:15 UT (circular flare ribbon (CFR) and remote brightening appeared), 04:16 UT (WL emission appeared), and 04:40 UT (after the flare). The green patches in panels (a4)–(d4) represent locations of WL enhancement.
Other Images in This Article

Copyright and Terms & Conditions
© 2018. The American Astronomical Society. All rights reserved.
Copyright ©
2025 Astronomy Image Explorer. All Rights Reserved.