Image Details
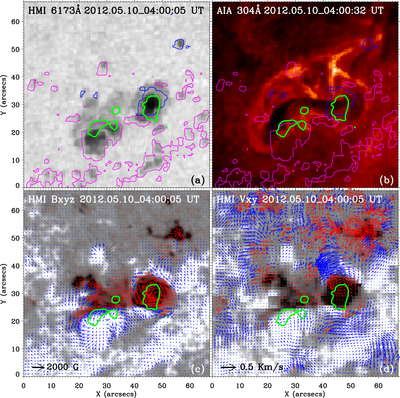
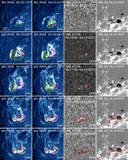
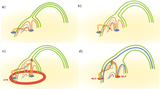
Caption: Figure 5.
Upper panels: HMI continuum intensity (a) and AIA 304 Å (b) images taken at 04:00 UT on 2012 May 10. Magenta and blue contours represent the positive and negative magnetic fields with a level of ﹩| {B}_{l}| =500\,{\rm{G}}﹩. Lower panels: HMI vector magnetic field (c) and horizontal velocity field (d) overlaid on the simultaneously taken longitudinal magnetogram. The velocity field is obtained using the method of the differential affine velocity estimator (DAVE). Red and blue arrows represent velocity vectors at locations of negative and positive fluxes, respectively. Green contours mark the regions of WL enhancement. Here, the contour level is ﹩(I-{I}_{0})/{I}_{0}=0.05﹩, where I0 and I refer to the HMI continuum intensities at 04:15:50 UT and 04:17:20 UT, respectively.
Other Images in This Article

Copyright and Terms & Conditions
© 2018. The American Astronomical Society. All rights reserved.