Image Details
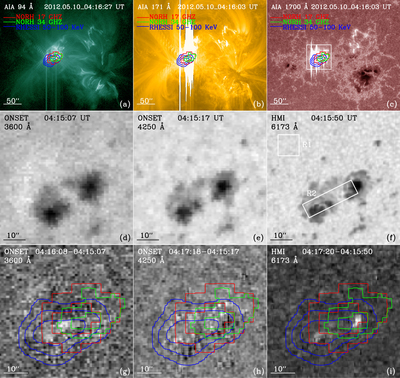
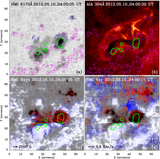
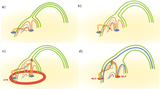
Caption: Figure 2.
Spatial relationship between the white-light emission and the hard X-ray and microwave emissions. Panels (a)–(c) are the AIA 94 Å, 171 Å and 1700 Å images taken at 04:16 UT, close to the flare peak. The white box in panel (c) corresponds to the FOV of panels (d)–(i). Panels (d)–(f) are the ONSET 3600 Å, 4250 Å and HMI 6173 Å images taken at 04:15 UT. Panels (g)–(i) are the difference images of these three passbands. Red and green contours in these panels represent the microwave 17 GHz and 34 GHz emissions observed by NoRH with levels of 30% and 70% of the maximum intensity. Blue contours represent the RHESSI 50–100 KeV emission with levels of 50%, 70%, and 90% of the maximum intensity. Regions R2 and R1 in panel (f) refer to the area where we obtain the variation of the white-light emission and a quiet-Sun region where we use for the estimation of the error for WL emission, respectively.
Other Images in This Article

Copyright and Terms & Conditions
© 2018. The American Astronomical Society. All rights reserved.