Image Details
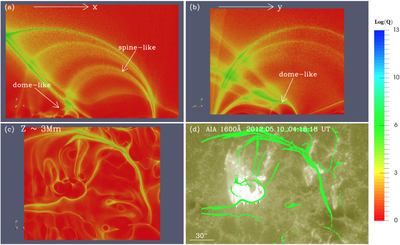
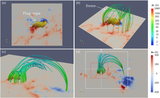
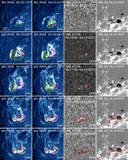
Caption: Figure 7.
QSLs on the slices shown in Figure 6(d). They are calculated based on the potential field extrapolation using the HMI full-disk vector magnetogram at 04:00 UT. (a, b) QSLs on the x–z and y–z planes passing through the center of the negative-polarity sunspot, respectively. A dome-like structure can be seen. (c) QSLs on the plane marked by the white box in Figure 6(d) at the height of Z ∼ 3 Mm. (d) AIA 1600 Å image taken at 04:18 UT. The green contours correspond to the QSLs in panel (c) with a level of Q = 103.
Other Images in This Article
Copyright and Terms & Conditions
© 2018. The American Astronomical Society. All rights reserved.
Copyright ©
2025 Astronomy Image Explorer. All Rights Reserved.