Image Details
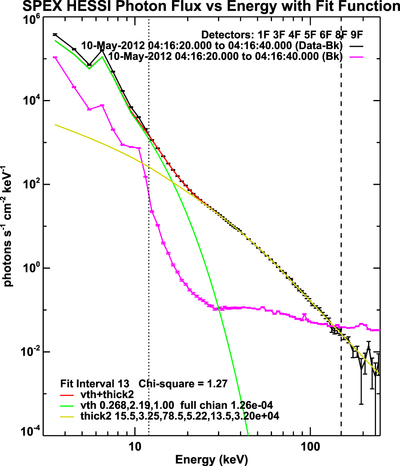
Caption: Figure 4.
RHESSI energy spectrum acquired in the time interval of 04:16:20–04:16:40 UT, around the peak time of the flare. The black curve is the observational spectral data after subtracting the background (purple curve), which is fitted by a variable thermal function (green), and a non-thermal thick-target bremsstrahlung function (yellow). The two vertical lines (dotted and dashed) indicate the fitting energy ranges. From the fitting of the spectrum, we have obtained an EM of 2.68 × 1048 cm−3, a temperature of 25.4 MK and a spectral index of 3.25.
Other Images in This Article

Copyright and Terms & Conditions
© 2018. The American Astronomical Society. All rights reserved.
Copyright ©
2025 Astronomy Image Explorer. All Rights Reserved.