Image Details
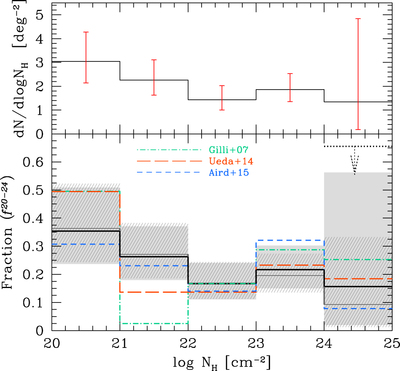
Caption: Figure 12.
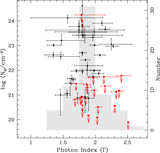
Intrinsic ﹩{N}_{{\rm{H}}}﹩ distributions (upper panel) and fraction relative to the total number of objects in the intrinsic distribution (shaded gray, lower panel). The distributions presented here are for ﹩{N}_{{\rm{H}}}﹩ derived by the baseline model, except for the heavily obscured sources (i.e., ﹩\mathrm{log}[{N}_{{\rm{H}}}/{\mathrm{cm}}^{-2}]\geqslant 23﹩) for which the BNTORUS model estimates are adopted. Error bars reflect the low counting statistics of the observed ﹩{N}_{{\rm{H}}}﹩ distribution (Figure 10). The shaded gray and hatched dark gray regions represent the ﹩1\sigma ﹩ range of derived fractions assuming different absorption bias corrections with ﹩{\theta }_{\mathrm{oa}}﹩ in the BNTORUS model of 60° and 30°, respectively (see Figure 11). In the ﹩\mathrm{log}({N}_{{\rm{H}}}/{\mathrm{cm}}^{-2})=24\mbox{--}25﹩ bin, we also report the 90% upper limits as dotted lines. Model predictions from G07, U14, and Aird et al. (2015a) are shown in dotted–dashed green, long-dashed orange, and short-dashed blue, respectively.
Other Images in This Article

Show More
Copyright and Terms & Conditions
© 2018. The American Astronomical Society. All rights reserved.