Image Details
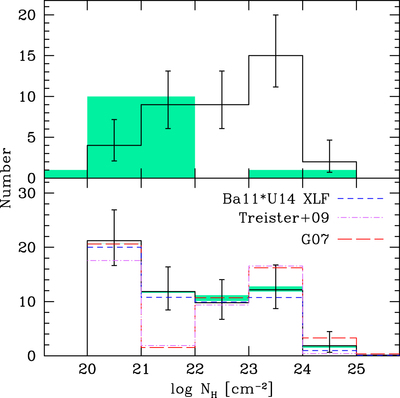
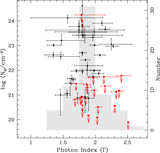
Caption: Figure 10.
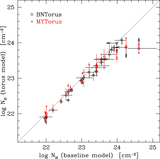
Upper panel: column density distribution from the baseline spectral model (black histogram), with error bars calculated assuming low counting statistics. Shaded green histogram reports 90% upper limits for data sets with limited constraining power (i.e., high-redshift, low ﹩{N}_{{\rm{H}}}﹩, or sources with only NuSTAR spectra). Lower panel: black line shows the distribution in which the ﹩{N}_{{\rm{H}}}﹩ best-fit values and upper limits from the baseline model have been randomized as described in Section 5. Green indicates the range of ﹩{N}_{{\rm{H}}}﹩ distribution by substituting the baseline-derived measurements for the sources with ﹩\mathrm{log}({N}_{{\rm{H}}}/{\mathrm{cm}}^{-2})\geqslant 23﹩ with those derived by adopting the torus models. Red (long dashed), blue (dashed), and magenta (dot dashed) histograms are model predictions from G07 and BA11 using the U14 XLF and Treister et al. (2009).
Other Images in This Article

Show More
Copyright and Terms & Conditions
© 2018. The American Astronomical Society. All rights reserved.