Image Details

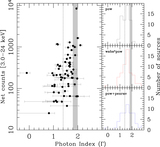
Caption: Figure 2.
Left panel: net counts in the full (3–24 keV) energy band from a 30″ aperture vs. the hard (8–24 keV) deblended aperture-corrected flux for the hard-band detected objects in the NuSTAR-COSMOS (red squares), NuSTAR-ECDF-S (blue triangles), NuSTAR-EGS (magenta diamonds), and NuSTAR-Serendip (green circles) catalogs. For the COSMOS sources, the flux has been extrapolated from the 20″ apertures reported in C15, assuming a constant conversion factor of 1.47 based on the on-axis NuSTAR point-spread function. The horizontal dashed line indicates the threshold value of ﹩7\times {10}^{-14}\,\mathrm{erg}\,{{\rm{s}}}^{-1}\,{\mathrm{cm}}^{-2}﹩ defining our sample. Right panel: spectroscopic redshift distribution of our sample (open histogram) compared to the the 199 local sources studied by Swift-BAT in Burlon et al. (2011; dark gray, with normalization and histogram binning rescaled by a factor of 10). The arrow indicates the median redshift value for the sample (﹩\langle z\rangle =0.58﹩) and the light gray region shows the interquartile range.
Other Images in This Article

Show More
Copyright and Terms & Conditions
© 2018. The American Astronomical Society. All rights reserved.