Image Details

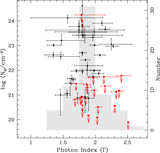
Caption: Figure 9.
Comparison of column density values from the best-fit baseline model and torus models for the obscured sources. Black hollow circles report values from the BNTORUS model. Red dots report values from the MYTORUS model.
Other Images in This Article

Show More
Copyright and Terms & Conditions
© 2018. The American Astronomical Society. All rights reserved.
Copyright ©
2025 Astronomy Image Explorer. All Rights Reserved.