Image Details
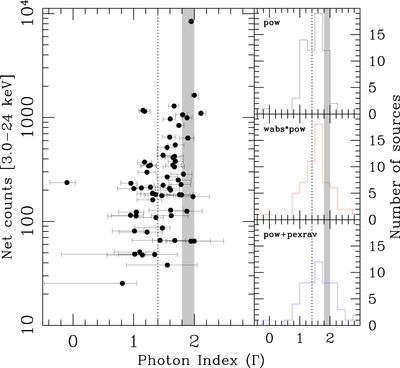
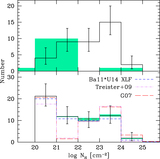
Caption: Figure 3.
Left panel: 3–24 keV net counts vs. photon index for the NuSTAR-only joint fit derived using a power-law model (black dots). Right panels (from top to bottom): black, red, and blue histograms report the distribution for the power-law, absorbed power-law, and power-law plus reflection component models, respectively. Gray regions represent the canonical range of Γ values measured in the literature for the power-law component. The dotted line represents the 3–15 keV slope of the CXB as measured by HEAO-1 (Marshall et al. 1980).
Other Images in This Article

Show More
Copyright and Terms & Conditions
© 2018. The American Astronomical Society. All rights reserved.
Copyright ©
2025 Astronomy Image Explorer. All Rights Reserved.