Image Details
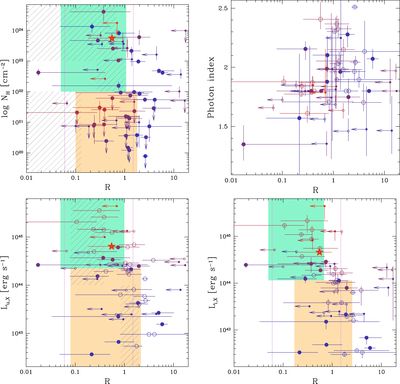
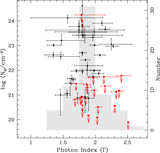
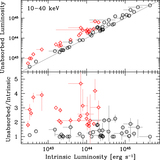
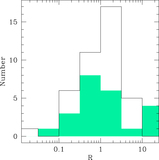
Caption: Figure 8.
Reflection parameter against ﹩{N}_{{\rm{H}}}﹩ (top-left panel), photon index (top-right panel), unabsorbed luminosity ﹩{L}_{{\rm{u}},{\rm{X}}}﹩ (bottom-left panel), and intrinsic coronal luminosity ﹩{L}_{{\rm{i}},{\rm{X}}}﹩ (bottom-right panel). Colors reflect the redshift of each source, with redder colors representing more distant objects. In the R vs. ﹩{L}_{{\rm{X}}}﹩ and R vs. Γ plots, empty (filled) circles represent unobscured (obscured) AGN. Vertical lines mark the interquartile interval for R in the entire sample. Shaded green (yellow) regions represent the interquartile ranges for obscured (unobscured) and more (less) luminous sources (the latter being separated at a median luminosity). In the R vs. luminosity and R vs. ﹩{N}_{{\rm{H}}}﹩ plots, the red star represents the high-redshift quasar detected in the ECDF-S field and analyzed in Del Moro et al. (2014). The hatched regions in the R vs. ﹩{L}_{{\rm{u}},{\rm{X}}}﹩ represent 90% error range for bins in ﹩{N}_{{\rm{H}}}﹩ and LX, as measured from the stacking analysis performed by DM17 on a large sample of NuSTAR-detected sources. Values of interquartile ranges are also reported in Table 6. See Section 4.4 for the definition of ﹩{L}_{{\rm{u}},{\rm{X}}}﹩ and ﹩{L}_{{\rm{i}},{\rm{X}}}﹩.
Other Images in This Article

Show More
Copyright and Terms & Conditions
© 2018. The American Astronomical Society. All rights reserved.