Image Details

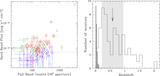
Caption: Figure 5.
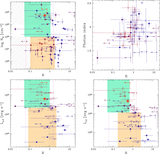
Intrinsic column density (left-hand y-axis) vs. photon index from the baseline modeling. Red arrows are 90% c.l. upper limits on ﹩{N}_{{\rm{H}}}﹩. The shaded gray histogram reports the distribution of Γ (right-hand y-axis). Data points without error-bars in Γ are sources for which the value of Γ was fixed to a value of 1.8 during the modeling because of poor constraints due to a combination of limited statistics and large column densities.
Other Images in This Article

Show More
Copyright and Terms & Conditions
© 2018. The American Astronomical Society. All rights reserved.
Copyright ©
2025 Astronomy Image Explorer. All Rights Reserved.