Image Details
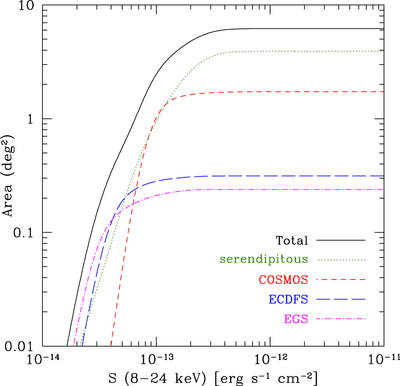
Caption: Figure 1.
Total and individual sensitivity curves as a function of the hard-band flux for the surveys included in our sample. Black solid curve is for the entire sample, magenta dotted–dashed is for EGS, blue long-dashed is for ECDF-S, red short-dashed is for COSMOS, and green dotted is for the serendipitous survey.
Other Images in This Article
Show More
Copyright and Terms & Conditions
© 2018. The American Astronomical Society. All rights reserved.
Copyright ©
2025 Astronomy Image Explorer. All Rights Reserved.