Image Details
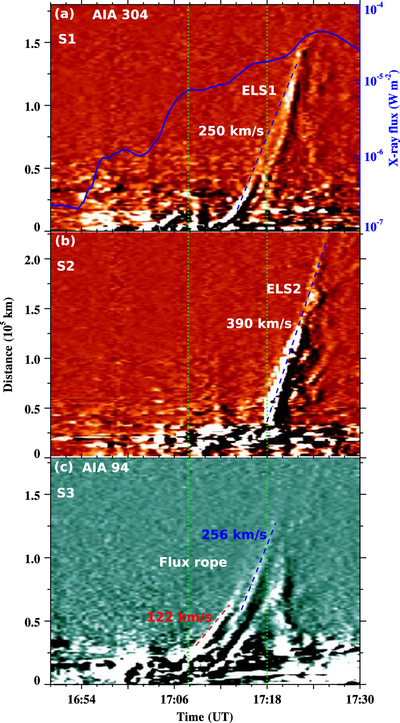
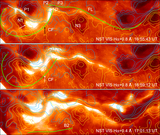
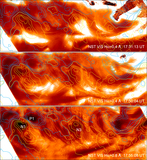
Caption: Figure 13.
Stack plots produced along the slits S1–S3 using a series of AIA 304 and 94 Å running difference images. The blue curve in the top panel is the GOES 0.5–4 Å soft X-ray flux profile. The first vertical dashed line marks the appearance of the FR in AIA hot channels 94 and 131 Å, whereas the second line marks the eruption of ELS2.
Other Images in This Article
Show More
Copyright and Terms & Conditions
© 2015. The American Astronomical Society. All rights reserved.
Copyright ©
2025 Astronomy Image Explorer. All Rights Reserved.