Image Details
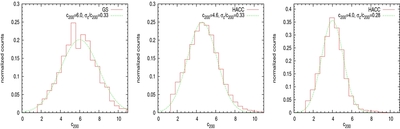
Caption: Figure 13.
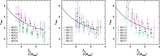
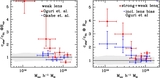
c– M distribution at three mass bins— M 200 = 5 × 10 12 h −1 M ☉ (left from the GS run), 1.5 × 10 14 h −1 M ☉ (middle, HACC), and 8 × 10 14 h −1 M ☉ (right, HACC)—from the halos drawn from the full sample at z = 0. Lines show the Gaussian distribution with standard deviation σ c / c ~ 0.33 in the left and center panels, and σ c / c ~ 0.28 in the rightmost panel.
Other Images in This Article
Show More
Copyright and Terms & Conditions
© 2013. The American Astronomical Society. All rights reserved.
Copyright ©
2025 Astronomy Image Explorer. All Rights Reserved.