Image Details

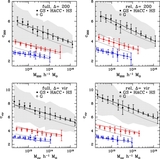
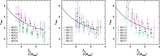
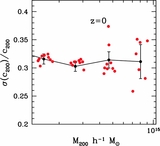
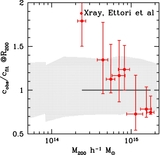
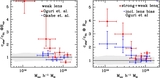
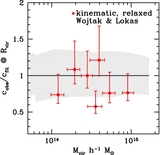
Caption: Figure 7.
Ratio of observed concentration to theoretical predictions for relaxed cluster observations. The first two sets of data are taken from Schmidt & Allen (2007) and Buote et al. (2007; left panel, for details see the text). The shaded area represents the 1σ boundary for the theoretical predictions. The right panel shows the comparison against observations of the Chandra Cluster Cosmology Project (Vikhlinin et al. 2009). This data set includes updates to the results of Vikhlinin et al. (2006) and adds six new clusters (Table 5). Note that each data point actually represents observations of multiple clusters.
Other Images in This Article
Show More
Copyright and Terms & Conditions
© 2013. The American Astronomical Society. All rights reserved.