Image Details
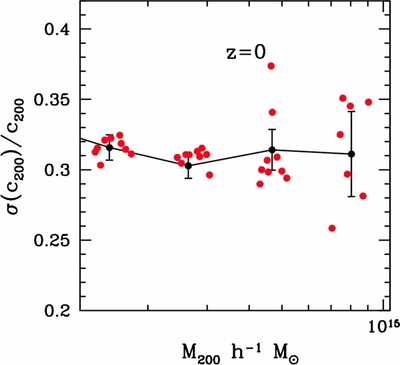
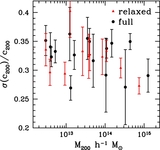
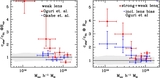
Caption: Figure 6.
c 200– M 200 distribution at z = 0 (full sample) when wCDM parameters are varied, following the characterization of Figure 4. The scatter is larger at high masses due to lower numbers of halos in high-mass bins.
Other Images in This Article
Show More
Copyright and Terms & Conditions
© 2013. The American Astronomical Society. All rights reserved.
Copyright ©
2025 Astronomy Image Explorer. All Rights Reserved.