Image Details

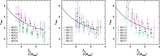
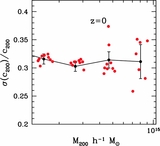
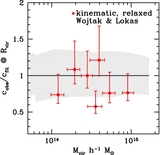
Caption: Figure 4.
c 200– M 200 distribution for the relaxed and full halo samples characterized by the ratio of the standard deviation to the mean value of c 200. All three redshifts are plotted. Note that σ c / c shows no redshift evolution. The case of Δ = Δ vir shows identical behavior.
Other Images in This Article
Show More
Copyright and Terms & Conditions
© 2013. The American Astronomical Society. All rights reserved.
Copyright ©
2025 Astronomy Image Explorer. All Rights Reserved.