Image Details
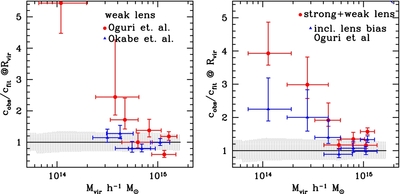
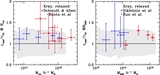
Caption: Figure 9.
Theoretical vs. observed c– M relation for weak and strong lensing. The left panel shows weak lensing data from Okabe et al. (2010) and Oguri et al. (2012). The Okabe et al. (2010) results are in very good agreement with the predictions, while the Oguri et al. (2012) results are strongly discrepant at the low-mass end. The right panel shows the combined strong and weak lensing results from Oguri et al. (2012) including their bias model-corrected prediction (blue). The correction reduces the discrepancy significantly but some tension remains below ~4 × 10 14 h −1 M ☉.
Other Images in This Article
Show More
Copyright and Terms & Conditions
© 2013. The American Astronomical Society. All rights reserved.