Image Details
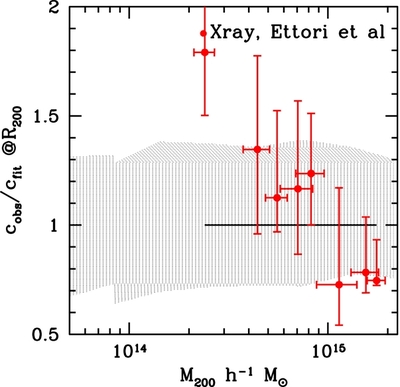
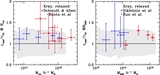
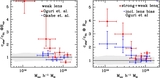
Caption: Figure 8.
Ratio of observed concentration to theoretical predictions for the XMM-Newton cluster observations of Ettori et al. (2011). The shaded area represents the 1σ boundary for the theoretical predictions. Each data point actually represents observations of multiple clusters.
Other Images in This Article
Show More
Copyright and Terms & Conditions
© 2013. The American Astronomical Society. All rights reserved.
Copyright ©
2025 Astronomy Image Explorer. All Rights Reserved.