Image Details
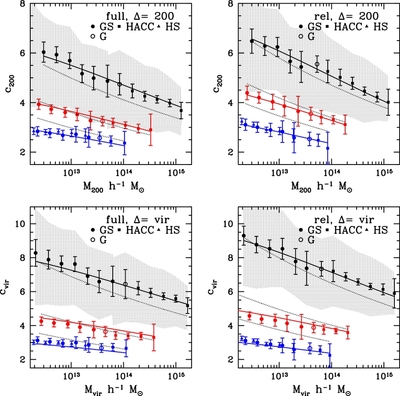
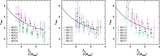
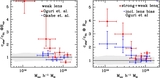
Caption: Figure 1.
c– M relations at radii r = R 200 and r = R vir for z = 0 (black), 1 (red), and 2 (blue) for the full (left panels) and relaxed samples (right panels), combining results of multiple simulations. The black solid lines at z = 0 are power-law fits, α = −0.08 for the full sample, and α = −0.084 for the relaxed halos. The solid red and blue curves are from the global fit (across all redshifts) discussed in Section 4.2 and shown in Figure 2. The error bars represent the error in determining the mean of the concentration in each mass bin (the difference between the mean and the median is insignificant). At a given mass, the distribution of concentrations is Gaussian with standard deviation σ c / c ~ 1/3 (cf. Section 4.3)—the shaded region shows the 1σ boundary for z = 0. The dotted curves are fitting formulae for the median concentration as given by Duffy et al. (2008).
Other Images in This Article
Show More
Copyright and Terms & Conditions
© 2013. The American Astronomical Society. All rights reserved.