Image Details
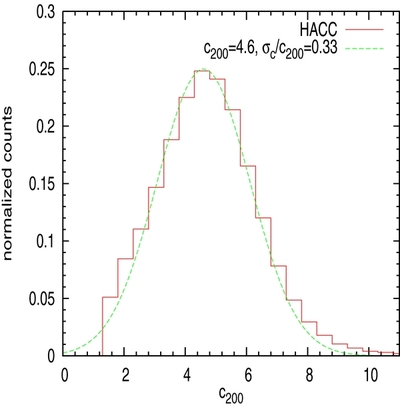
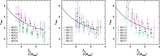
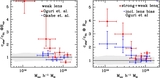
Caption: Figure 3.
c– M distribution at a mass bin centered at 1.5 × 10 14 h −1 M ☉ using results from the HACC simulation at z = 0. The lines show a Gaussian distribution with standard deviation σ c / c ~ 0.33.
Other Images in This Article
Show More
Copyright and Terms & Conditions
© 2013. The American Astronomical Society. All rights reserved.
Copyright ©
2025 Astronomy Image Explorer. All Rights Reserved.