Image Details
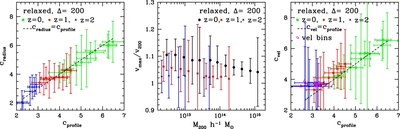
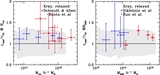
Caption: Figure 12.
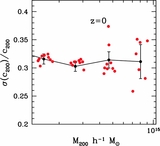
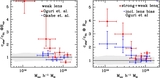
Comparison (left and right panels) between c 200 measured for relaxed clusters using profile fitting and that obtained from the radius ratio (left panel) and v max/ v 200 (right panel). The diagonal line represents the ideal case when the measured concentrations agree exactly. The middle panel shows the ratio of the maximum circular velocity to that at radius R 200 for z = 0 for the relaxed sample as a function of mass. Note the smooth crossover between the GS and HACC runs at M 200 ~ 10 14 h −1 M ☉ at redshifts z = 0, 1 (cf. Figure 1).
Other Images in This Article
Show More
Copyright and Terms & Conditions
© 2013. The American Astronomical Society. All rights reserved.