Image Details
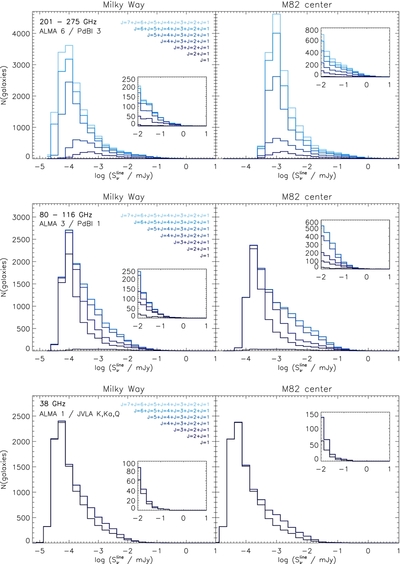
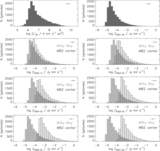
Caption: Figure 9.
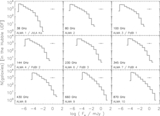
Number of expected CO line detections per line flux bin for three frequency ranges and two different molecular gas excitation scenarios. The line fluxes are computed assuming a line width of 300 km s −1. Top: frequency between 201 and 275 GHz (ALMA band 6 and PdBI/NOEMA band 3); middle: frequency between 80 and 116 GHz (ALMA band 3 and PdBI/NOEMA band 1); bottom: frequency between 18 and 50 GHz (ALMA band 1 and JVLA bands K, Ka, and Q). The left-hand and right-hand panels assume a Milky Way and M82 CO spectral line energy distribution, respectively. The lowest, darkest color histograms show the distribution of CO(1–0) fluxes, the next (lighter-colored) histogram shows the joint distribution of CO(1–0) and CO(2–1) fluxes, i.e., the distribution of CO(2–1) can be inferred from the increment in the histogram relatively to the histogram below, and so on until the lightest-colored histogram, which shows the sum of the distributions of all the CO line fluxes from J = 1 to J = 7.
Other Images in This Article
Show More
Copyright and Terms & Conditions
© 2013. The American Astronomical Society. All rights reserved.