Image Details
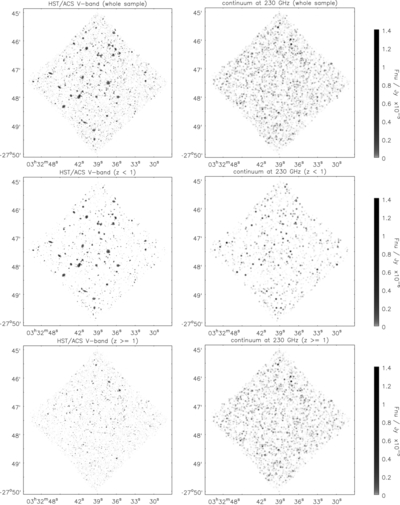
Caption: Figure 6.
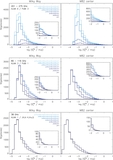
Comparison between the UDF observed in the V band (left-hand panels) and at 230 GHz (right-hand panels; using our predictions); top panels: whole sample; middle panels: galaxies with z < 1; bottom panels: galaxies with z ⩾ 1. The V-band image was generated using ACS F606W image of the UDF (from the HST archive); the 230 GHz image was generated assuming point sources and convolving with the ALMA synthetic beam in the compact configuration, 1.5 arcsec. The gray-scale bar shows the predicted (sub-)millimeter fluxes of the galaxies; no noise is included in either the optical or (sub-)millimeter maps. We note that these maps do not include the SMG galaxy detected in the UDF as part of the LESS survey (LESSJ0333243.6-274644).
Other Images in This Article
Show More
Copyright and Terms & Conditions
© 2013. The American Astronomical Society. All rights reserved.