Image Details
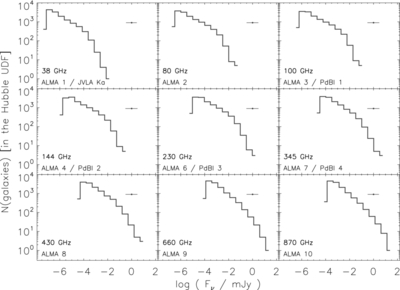
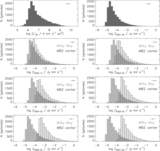
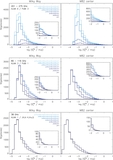
Caption: Figure 7.
Distribution of the predicted continuum flux densities per flux density bin in different (sub-)millimeter bands for all the galaxies in our sample. The frequency is indicated in the bottom-left corner of each panel, as well as the corresponding bands in different observatories. The median confidence range for the continuum flux in each band is plotted in the upper right-hand corner of each panel.
Other Images in This Article
Show More
Copyright and Terms & Conditions
© 2013. The American Astronomical Society. All rights reserved.
Copyright ©
2025 Astronomy Image Explorer. All Rights Reserved.