Image Details
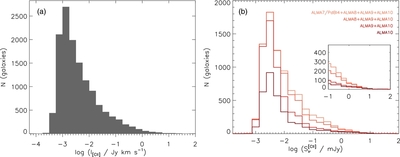
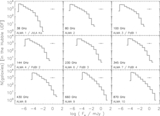
Caption: Figure 10.
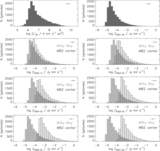
(a) Distribution of the velocity-integrated flux of the [Cii] line,
I
[C II], for all the galaxies in our sample. (b) Distribution of the number of detections as a function of line flux,
 (computed assuming a 300 km s
−1 line width), expected in the highest frequency bands available for ALMA and PdBI/NOEMA.
(computed assuming a 300 km s
−1 line width), expected in the highest frequency bands available for ALMA and PdBI/NOEMA.
Other Images in This Article
Show More
Copyright and Terms & Conditions
© 2013. The American Astronomical Society. All rights reserved.
Copyright ©
2025 Astronomy Image Explorer. All Rights Reserved.