Image Details
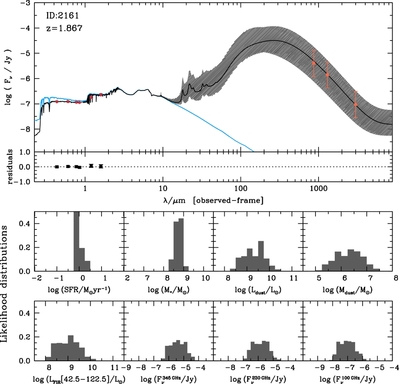
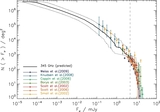
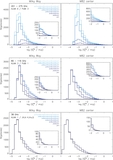
Caption: Figure 2.
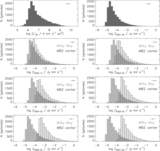
Example of a fit to the observed optical spectral energy distribution of a UDF galaxy at z = 1.867 (red points). The black line represents the best-fit model SED; the blue line represents the unattenuated (i.e., dust-free) stellar spectrum. The gray-shaded area represents the range of all infrared dust emission models in our model library that are consistent with the observed optical/near-infrared fluxes in terms of energy balance. The orange points represent the median of the probability density function (PDF) for the predicted fluxes at 345, 230, and 100 GHz (three arbitrary chosen (sub-)millimeter bands), and the associated error bars represent the confidence range, i.e., the 16th–84th percentile range of the PDF. The residuals of the fit are plotted in the panel at the bottom of the SED. The eight bottom panels show the PDFs of several parameters: star formation rate; stellar mass; total dust luminosity; dust mass; far-infrared luminosity between 42.5 and 122.5 μm; and flux densities in the three randomly chosen bands at 345, 230, and 100 GHz.
Other Images in This Article
Show More
Copyright and Terms & Conditions
© 2013. The American Astronomical Society. All rights reserved.