Image Details
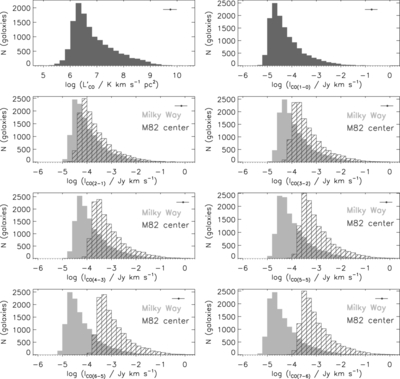
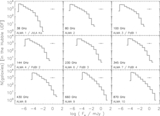
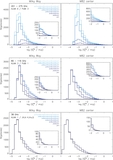
Caption: Figure 8.
Top panels: distribution of total CO line luminosity L′ CO (top left) and velocity-integrated flux of the CO(1–0) line (top right) for all our sample. Other panels (starting at second row): distribution of the predicted velocity-integrated CO line fluxes for transitions J = 2, 3, 4, 5, 6, and 7. These fluxes are computed from the predicted CO(1–0) line, using the CO SLEDs of Weiss et al. (2007) for the Milky Way (light gray histogram) and the center of M 82 (dark gray, dashed histogram). These two extreme CO SLEDs should bracket a large realistic range of possible CO excitations of star-forming galaxies (e.g., Weiss et al. 2007).
Other Images in This Article
Show More
Copyright and Terms & Conditions
© 2013. The American Astronomical Society. All rights reserved.