Image Details
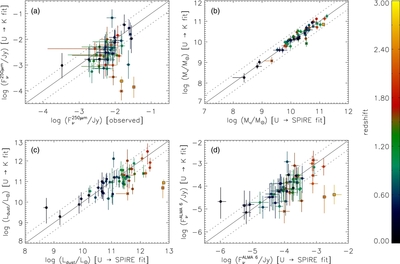
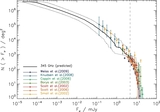
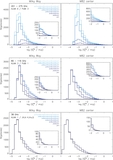
Caption: Figure 4.
(a) Comparison between the observed Herschel/SPIRE 250 μm flux ( x-axis) and our Bayesian median-likelihood estimate of the 250 μm flux of each galaxy based on SED fits from the U band to the K band ( y-axis). The other three panels show the comparison between our Bayesian median-likelihood estimates of GOODS/ Herschel galaxy parameters obtained when fitting the full SED from the U band to the longest available SPIRE band ( x-axis), and when fitting only the SED from the U band to the K band ( y-axis): (b) stellar mass; (c) total dust luminosity; (d) continuum flux in the ALMA band 6 (230 GHz). Each galaxy is color-coded according to redshift. The error bars show the 16th–84th percentile range of the likelihood distributions. In all panels, the gray solid line is the identity line, and the dotted lines show a ±0.5 dex offset for reference. The two points marked with crosses are galaxies that show a significant AGN contribution in the infrared; the two points marked with squares are galaxies which show a ULIRG-like SED, i.e., they seem to be very optically thick (given their high intrinsic infrared-to-optical emission ratios). Our SED modeling may not be reliable for these four galaxies, but overall we find a good agreement between the estimates derived from fitting the full SED and those from fitting the SED only up to the K band.
Other Images in This Article
Show More
Copyright and Terms & Conditions
© 2013. The American Astronomical Society. All rights reserved.