Image Details
Caption: Figure 3.
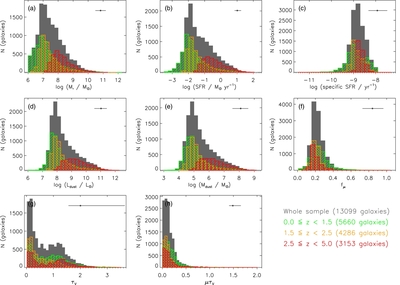
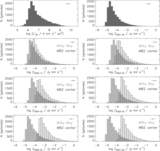
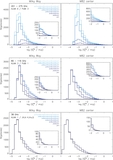
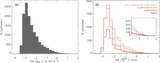
Distributions of the median-likelihood parameters derived from SED fitting for the whole Hubble UDF galaxy sample. (a) Stellar
mass; (b) star formation rate averaged over the last 100 Myr; (c) specific star formation rate, defined as the star formation
rate divided by stellar mass; (d) total dust luminosity; (e) dust mass; (f) fraction of total dust luminosity contributed
by the diffuse ISM,
f
μ; (g) effective
V-band optical depth seen by stars younger than 10 Myr in birth clouds,
 ; (h) effective
V-band optical depth seen by stars older than 10 Myr in the diffuse ISM. The gray histograms represent the whole sample, and
the colored histograms represent the distribution of parameters of galaxies divided into three redshift bins: green:
z < 1.5; yellow: 1.5 ⩽
z < 2.5; red:
z > 2.5. The error bars in the top right-hand corner of each plot represent the median confidence range for each parameter.
We note that the sharp drop toward lower values of stellar mass, SFR, and dust mass/luminosity is due to incompleteness of
the photometric catalog toward fainter flux levels (see Figure
1).
; (h) effective
V-band optical depth seen by stars older than 10 Myr in the diffuse ISM. The gray histograms represent the whole sample, and
the colored histograms represent the distribution of parameters of galaxies divided into three redshift bins: green:
z < 1.5; yellow: 1.5 ⩽
z < 2.5; red:
z > 2.5. The error bars in the top right-hand corner of each plot represent the median confidence range for each parameter.
We note that the sharp drop toward lower values of stellar mass, SFR, and dust mass/luminosity is due to incompleteness of
the photometric catalog toward fainter flux levels (see Figure
1).
Other Images in This Article
Show More
Copyright and Terms & Conditions
© 2013. The American Astronomical Society. All rights reserved.