Image Details

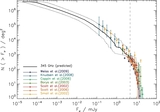
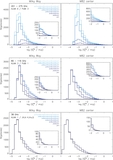
Caption: Figure 14.
Observed frequency of the CO lines CO(1–0) to CO(7–6) (from darker blue to lighter blue lines) and [C ii] 158 μm (red line) as a function of redshift. The gray-shaded and green-shaded areas show the frequency ranges sampled by the ALMA, JVLA, and PdBI/NOEMA bands considered in this paper.
Other Images in This Article
Show More
Copyright and Terms & Conditions
© 2013. The American Astronomical Society. All rights reserved.
Copyright ©
2025 Astronomy Image Explorer. All Rights Reserved.