Image Details
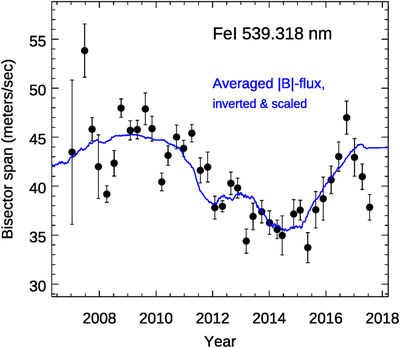
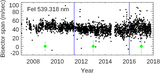
Caption: Figure 6.
Bisector span (in m s−1) for the Fe I line at 539.318 nm vs. date. The blue line is the disk average of the total magnetic flux, plotted on an inverted scale (greater flux being downward) and matched to the amplitude of the bisector variations. The points are 100 day averages of the bisector span, and their scatter exceeds the error bars due to temporal variations on times less than the 11 yr magnetic cycle.
Other Images in This Article

Copyright and Terms & Conditions
© 2023. The Author(s). Published by the American Astronomical Society.
Copyright ©
2025 Astronomy Image Explorer. All Rights Reserved.