Image Details
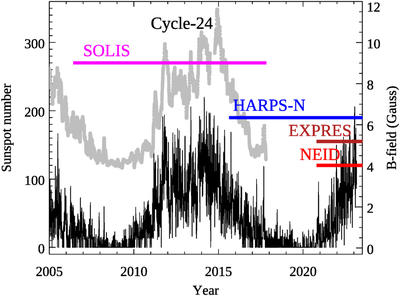
Caption: Figure 1.
Time span over which integrated-light solar spectra were acquired by the SOLIS project, HARPS-N, EXPRES, and NEID. The left Y-axis is the number of sunspots, showing the extent of solar activity in Cycle 24 and now increasing in Cycle 25. The points in gray are the spatially averaged magnetic flux on the solar disk in Gauss as measured by the SOLIS spectromagnetograph (read Y-axis on the right).
Other Images in This Article


Copyright and Terms & Conditions
© 2023. The Author(s). Published by the American Astronomical Society.
Copyright ©
2025 Astronomy Image Explorer. All Rights Reserved.