Image Details
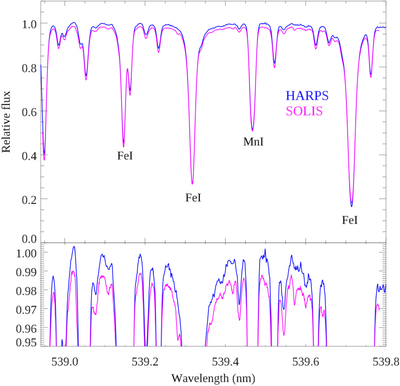
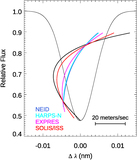
Caption: Figure 2.
Sample SOLIS spectrum covering the region near the Mn I line at 539.5 nm compared to an average of HARPS-N spectra acquired on the same day. Both spectra represent the full data for that single day of observing, randomly selected as 2015 August 17 (a high-humidity season for the SOLIS data). The lower panel expands the upper 5% of the spectrum, so that the noise can be seen (compare fluctuations of the two spectra in regions near the continuum). The SOLIS spectrum is offset downward by 1% to facilitate the visual comparison.
Other Images in This Article


Copyright and Terms & Conditions
© 2023. The Author(s). Published by the American Astronomical Society.
Copyright ©
2025 Astronomy Image Explorer. All Rights Reserved.