Image Details
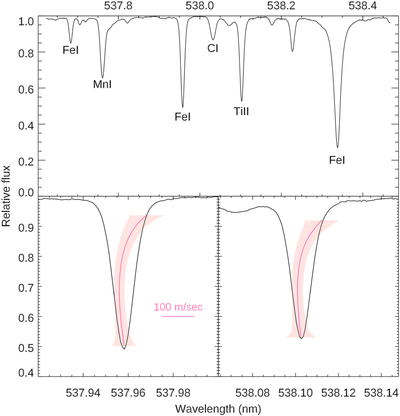
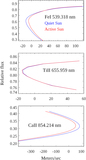
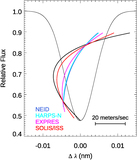
Caption: Figure 3.
Examples of bisectors that we measure using the SOLIS/ISS spectra. This example is for the spectral segment centered on the high-excitation line of neutral carbon at 538.032 nm. The two bottom panels expand two lines (left: Fe I 537.957 nm; right: Ti II 538.102 nm), with the average bisector for each line overplotted (in hot pink) on an even more expanded scale (refer to the 100 m s−1 legend). The bisectors plotted are average shapes over 3587 spectra. The rose-shaded region surrounding each bisector is the ±3σ uncertainty envelope of a single bisector measurement, and note that the velocity scale for the bisector is m s−1.
Other Images in This Article


Copyright and Terms & Conditions
© 2023. The Author(s). Published by the American Astronomical Society.