Image Details
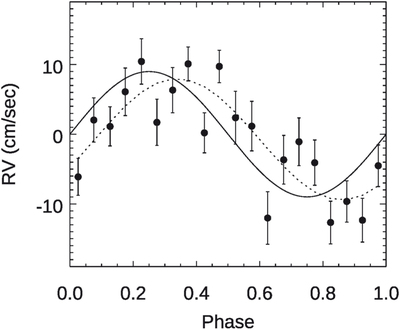
Caption: Figure 10.
Recovery of the injected RV signal with 9 cm s−1 amplitude by averaging over bisectors of 19 lines and binning to a resolution of 0.05 in orbital phase. The solid curve is the injected signal, and the dashed line is the best fit to the data and is consistent with the injected signal to within the errors (see text).
Other Images in This Article


Copyright and Terms & Conditions
© 2023. The Author(s). Published by the American Astronomical Society.
Copyright ©
2025 Astronomy Image Explorer. All Rights Reserved.