Image Details
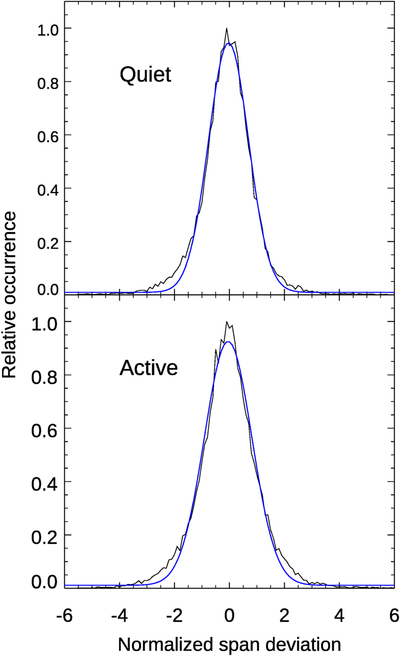
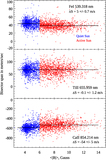
Caption: Figure 5.
Distribution of deviations in the bisector span, normalized by their observed standard deviation and divided into quiet-Sun and active-Sun periods. The measured distributions include all of the lines in Table 1. The blue curves are fitted Gaussian distributions.
Other Images in This Article


Copyright and Terms & Conditions
© 2023. The Author(s). Published by the American Astronomical Society.
Copyright ©
2025 Astronomy Image Explorer. All Rights Reserved.