Image Details
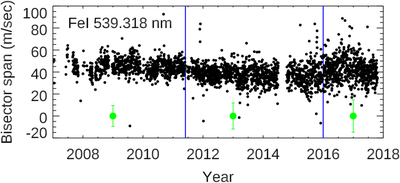
Caption: Figure 4.
Span of the bisector of the Fe I line at 539.318 nm vs. date. The vertical blue lines mark the approximate times between which the Sun was most active in Cycle 24 (compare to Figure 1). In addition to the decrease in bisector span during the middle period of high solar activity, there are also fluctuations due to telluric effects (Section 3.2 and Figure 9). The green points with error bars are not real data; they illustrate the ±3σ envelope due to random variations per point in the three regions.
Other Images in This Article


Copyright and Terms & Conditions
© 2023. The Author(s). Published by the American Astronomical Society.
Copyright ©
2025 Astronomy Image Explorer. All Rights Reserved.