Image Details
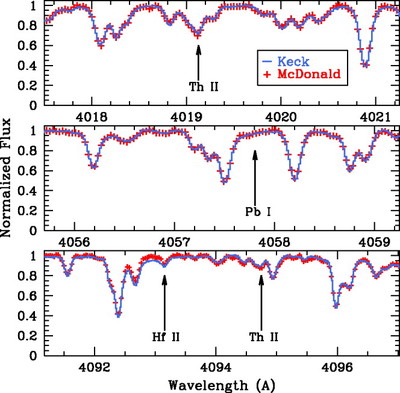
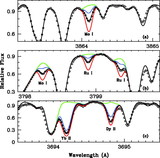
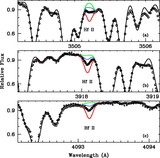
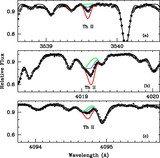
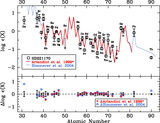
Caption: Fig. 1.
Examples of the reduced spectra taken with the Keck HIRESb (blue solid line) and McDonald 2d‐coudé spectrographs (red plus signs) for a sample of the wavelength regions displayed by Yushchenko et al. (2002, their Fig. 2) and Yushchenko et al. (2005, their Figs. 1–4): Th II at 4019.13 Å, Pb I at 4057.81 Å, Hf II at 4093.16 Å, and Th II at 4094.75 Å.
Other Images in This Article
Show More
Copyright and Terms & Conditions
© 2006. The American Astronomical Society. All rights reserved. Printed in U.S.A.
Copyright ©
2025 Astronomy Image Explorer. All Rights Reserved.