Image Details

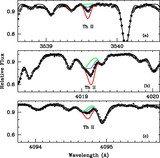
Caption: Fig. 5.
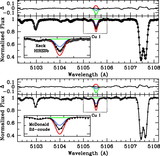
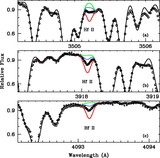
Selected spectra of n‐capture elements in the near‐UV wavelength region. Open circles represent the observed Keck HIRESb spectra. The solid lines represent synthetic spectra with variation only in the assumed abundance of the noted species. The black line shows the best fit between the synthetic and observed spectra with the abundance for each species given in col. (6) of Table 1. The red and blue lines show the change in the features with changes of ±0.4 dex in assumed abundance, respectively, and the green line shows the synthetic spectrum without any contribution from the species noted. In (b), the Mo I line is clearly detected but lies in the middle of a complex blend of Fe I and H I features. The abundance from this line is consistent with the cleaner Mo I λ3864.1 line but should be interpreted with caution.
Other Images in This Article

Show More
Copyright and Terms & Conditions
© 2006. The American Astronomical Society. All rights reserved. Printed in U.S.A.