Image Details
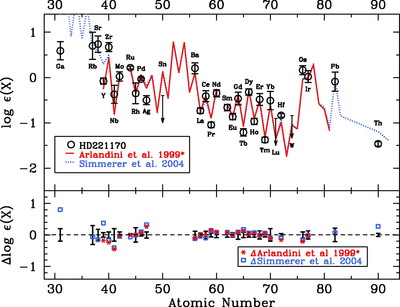
Caption: Fig. 10.
Comparison of the ﹩\mathrm{log}\,\epsilon ( \mathrm{X}\,) ﹩ abundances for ﹩Z> 30﹩ in HD 221170 with the scaled solar r‐process predictions from Simmerer et al. (2004; solid red line) and those based on Arlandini* (largely 1999; with modifications as described in § 5.2; dotted blue line). Both sets of predictions have been normalized to the value derived for ﹩\mathrm{log}\,\epsilon ( \mathrm{Eu}\,) ﹩ in HD 221170. In the top panel, the upper limits and open circles with error bars denote the stellar abundances. The bottom panel displays the difference defined as ﹩\Delta \mathrm{log}\,\epsilon ( \mathrm{X}\,) \equiv \mathrm{log}\,\epsilon ( \mathrm{X}\,) _{\mathrm{pred}\,}-\mathrm{log}\,\epsilon ( \mathrm{X}\,) _{\mathrm{obs}\,}﹩, where the error bars are those we adopted for the abundances derived for each element. Upper limits are not displayed in the bottom panel.
Other Images in This Article

Show More
Copyright and Terms & Conditions
© 2006. The American Astronomical Society. All rights reserved. Printed in U.S.A.