Image Details
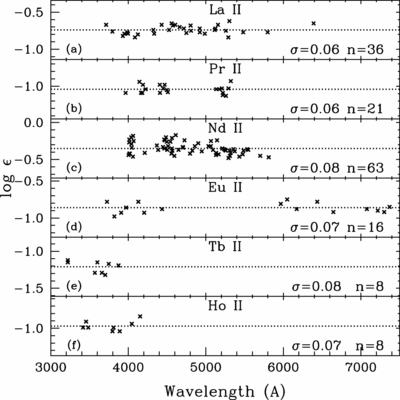
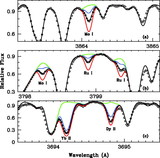
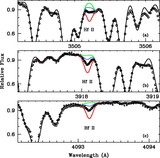
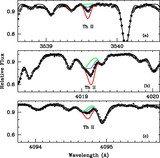
Caption: Fig. 8.
Abundances from individual lines of six rare earth element species, plotted against line wavelengths. The mean abundances are indicated by dotted horizontal lines, with the scatter about the mean (σ) and the number of lines employed (n) stated in each panel.
Other Images in This Article

Show More
Copyright and Terms & Conditions
© 2006. The American Astronomical Society. All rights reserved. Printed in U.S.A.
Copyright ©
2025 Astronomy Image Explorer. All Rights Reserved.