Image Details
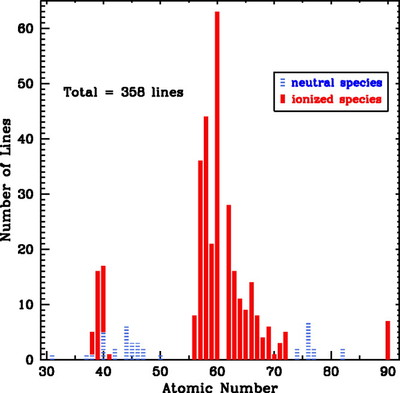
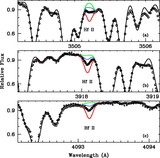
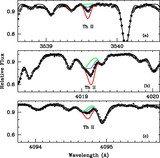
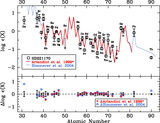
Caption: Fig. 3.
Number of transitions used in determining the abundances of the n‐capture elements. Blue dashed histograms and red solid histograms represent, respectively, neutral and first ionized species, as given in the figure legend.
Other Images in This Article

Show More
Copyright and Terms & Conditions
© 2006. The American Astronomical Society. All rights reserved. Printed in U.S.A.
Copyright ©
2025 Astronomy Image Explorer. All Rights Reserved.