Image Details

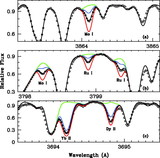
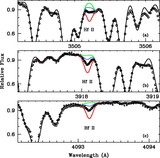
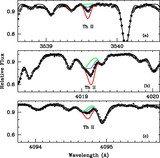
Caption: Fig. 4.
Observed and synthetic spectra of Cu I in HD 221170. The 6 Å swaths shown here illustrate the typical match between both the Keck HIRESb (circles) and McDonald 2d‐coudé (plus signs) spectra and the syntheses obtained from the stellar and smoothing parameters described in §§ 3.2 and 3.3. The Δ panels above each of the syntheses illustrate the differences to the respective fits. The inset illustrates a region 1 Å wide surrounding the feature at 5105.5 Å, as denoted by the dotted lines in the main panels. The solid lines represent synthetic spectra with variation only in the assumed Cu abundance. The black line shows the best fit between the synthetic and observed spectra. The red and blue lines show the change in the Cu I feature with changes of ±0.2 dex in assumed Cu abundance, respectively, and the green lines show the synthetic spectrum without any Cu contribution.
Other Images in This Article

Show More
Copyright and Terms & Conditions
© 2006. The American Astronomical Society. All rights reserved. Printed in U.S.A.