Image Details
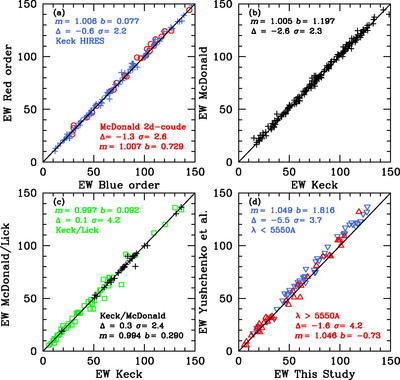
Caption: Fig. 2.
Comparisons of EWs for lines in common between the data sets discussed in § 2. (a) Overlapping orders within the Keck and McDonald data sets (blue plus signs and red circles, respectively); (b) lines in common in the Keck and McDonald data sets; (c) independently measured McDonald EWs (black plus signs) and Lick EWs (Fulbright 2000; green squares) vs. Keck EWs; (d) lines in common with Yushchenko et al. (2005), color‐coded by ﹩\lambda < 5550﹩ (blue downward‐pointing triangles) or >5550 Å (red upward‐pointing triangles). In all panels, we show the values of the slope (m) and zero‐point shifts (b) of the regressions (where the solid line represents a one‐to‐one relation), along with the mean differences (Δ) and standard deviations of the measurements (σ). The values were derived employing all EWs in common; the panel displays are restricted to EWs <150 mÅ.
Other Images in This Article

Show More
Copyright and Terms & Conditions
© 2006. The American Astronomical Society. All rights reserved. Printed in U.S.A.