

Image Details
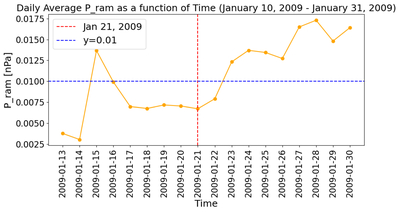
Caption: Figure A2.
Solar wind dynamic pressure estimated with the ENLIL model from 2009 January 10 until January 31. Red line marks ionospheric outflow detection. Blue line is the average value of the solar wind dynamic pressure as from a measure of the bow-shock position by M. F. Thomsen et al. (2019).
Other Images in This Article
Copyright and Terms & Conditions
© 2026. The Author(s). Published by the American Astronomical Society.

Copyright ©
2026 Astronomy Image Explorer. All Rights Reserved.
