

Image Details
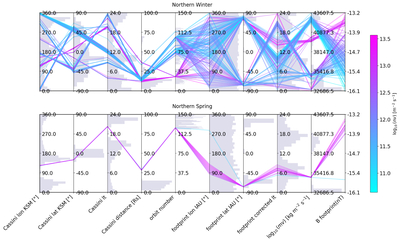
Caption: Figure 6.
Two-panel parallel coordinates plot of all 200 detection properties, separated by season. Upper panel: 186 pre-equinox detections (northern winter and southern summer, 2006 August–2009 July). Lower panel: 14 post-equinox detections (southern fall, 2010 January 7). Vertical axes (left to right): spacecraft longitude in KSM [0∘–360∘]; spacecraft latitude in KSM [−90∘ to +90∘]; spacecraft LT [0–24 h]; spacecraft distance from Saturn [RS]; orbit revolution number; ionospheric footprint longitude in IAU_SATURN [0∘–360∘]; footprint latitude; footprint corrected LT (travel-time adjusted) [0–24 h]; ﹩{\mathrm{log}}_{10}(m{v}_{{\rm{iono}}})﹩ [kg m−2 s−1] (mass flux density, note this axis differs from the number-flux color bar); magnetic field magnitude at the ionospheric footprint (Bfootprint, nT). Each line represents one detection, colored by ﹩{\mathrm{log}}_{10}(n{v}_{{\rm{iono}}})﹩ in m−2 s−1 (cool colormap; magenta = higher number flux, cyan = lower). Background gray histograms show Cassini’s favorable sampling distribution during the survey period (Figure 1).
Other Images in This Article
Copyright and Terms & Conditions
© 2026. The Author(s). Published by the American Astronomical Society.

