

Image Details
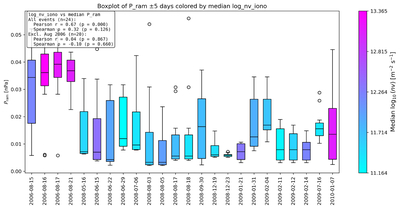
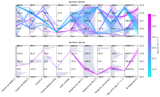
Caption: Figure 4.
Box plot of ENLIL-modeled solar wind ram pressure (Pram, in nPa on the y-axis) over a ±5 day window centered on each outflow event (24 days), colored by mean ﹩{\mathrm{log}}_{10}(nv)﹩ in m−2 s−1. Open circles mark individual Pram measurements that fall outside 1.5 times the interquartile range of the ±5 day window. A tentative positive correlation is visible between Pram 4–6 days prior to detection and nv, most clearly during northern winter; the correlation weakens toward northern spring. Both quantities are binned in 24 hr intervals. No definitive interpretation is possible given ENLIL’s propagation uncertainty at 9 au (see Section 2).
Other Images in This Article
Copyright and Terms & Conditions
© 2026. The Author(s). Published by the American Astronomical Society.

