

Image Details
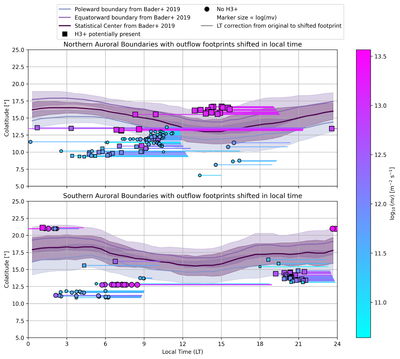
Caption: Figure 3.
Ionospheric outflow footprints overlaid on the LT-dependent average auroral oval of A. Bader et al. (2019) for the northern (top) and southern (bottom) hemispheres, in colatitude vs. LT. In each panel the three purple curves show the A. Bader et al. (2019) statistical ovals: the poleward boundary (light purple), the equatorward boundary (mid purple), and the statistical center of the oval (dark purple); the shaded band around each curve is the uncertainty reported by A. Bader et al. (2019). Outflow footprints are plotted at their travel-time-corrected LT (i.e., the LT at which the parcel left the ionosphere) and at the footprint colatitude. A short horizontal segment attached to each marker shows the LT shift from the geometric footprint LT at the time of the spacecraft measurement to the corrected LT, so that the length of the segment is proportional to the field-line travel time for that detection (segments that cross 00 LT are drawn in two pieces). Marker color encodes ﹩{\mathrm{log}}_{10}(nv)﹩ at 10,000 km on the shared color bar at right (same scale as Figure 1); marker size is proportional to ﹩{\mathrm{log}}_{10}(mv)﹩ (mass flux); marker shape distinguishes detections whose CAPS time-of-flight composition is consistent with the presence of ﹩{{{\rm{H}}}_{3}}^{+}﹩ (squares) from those where ﹩{{{\rm{H}}}_{3}}^{+}﹩ could not be identified (circles).
Other Images in This Article
Copyright and Terms & Conditions
© 2026. The Author(s). Published by the American Astronomical Society.

